def main():
    print(__file__ + " start!!")

    time = 0.0

    # RFID positions [x, y, yaw]
    RFID = np.array([[10.0, -2.0, 0.0],
                     [15.0, 10.0, 0.0],
                     [3.0, 15.0, 0.0],
                     [-5.0, 20.0, 0.0],
                     [-5.0, 5.0, 0.0]
                     ])

    # State Vector [x y yaw v]'
    xTrue = np.zeros((STATE_SIZE, 1))
    xDR = np.zeros((STATE_SIZE, 1))  # Dead reckoning

    # history
    hxTrue = []
    hxDR = []
    hz = []
    d_time = 0.0
    init = False
main에서 변수를 초기화하는 부분입니다. RFID는 랜드마크, xTrue는 Ground Truth, xDR Dead Reckoning State를 저장할 변수입니다.
def motion_model(x, u):
    F = np.array([[1.0, 0, 0],
                  [0, 1.0, 0],
                  [0, 0, 1.0]])

    B = np.array([[DT * math.cos(x[2, 0]), 0],
                  [DT * math.sin(x[2, 0]), 0],
                  [0.0, DT]])

    x = F @ x + B @ u
    return x

def calc_input():
    v = 1.0  # [m/s]
    yaw_rate = 0.2  # [rad/s]
    u = np.array([[v, yaw_rate]]).T
    return u
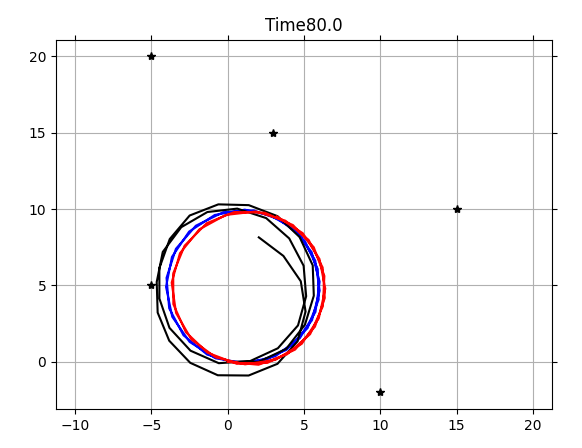
Control은 위와 같이 들어온다고 가정합니다. 속도는 일정하고 yaw를 일정하게 주기 때문에 원을 그리는 운동을 할 것 같습니다.

실제로 경로를 그려보니 위와 같이 나오네요.
    while SIM_TIME >= time:

        if not init:
            hxTrue = xTrue
            hxDR = xTrue
            init = True
        else:
            hxDR = np.hstack((hxDR, xDR))
            hxTrue = np.hstack((hxTrue, xTrue))

        time += DT
        d_time += DT
        u = calc_input()

        xTrue, z, xDR, ud = observation(xTrue, xDR, u, RFID)

        hz.append(z)

         if d_time >= show_graph_d_time:
            x_opt = graph_based_slam(hxDR, hz)
            d_time = 0.0
loop를 돌면서 랜드마크를 관측하고, 이를통해 SLAM을 수행합니다.
def observation(xTrue, xd, u, RFID):
xTrue = motion_model(xTrue, u)
# add noise to gps x-y
z = np.zeros((0, 4))
for i in range(len(RFID[:, 0])):
dx = RFID[i, 0] - xTrue[0, 0]
dy = RFID[i, 1] - xTrue[1, 0]
d = math.hypot(dx, dy)
angle = pi_2_pi(math.atan2(dy, dx)) - xTrue[2, 0]
phi = pi_2_pi(math.atan2(dy, dx))
if d <= MAX_RANGE:
dn = d + np.random.randn() * Q_sim[0, 0] # add noise
angle_noise = np.random.randn() * Q_sim[1, 1]
angle += angle_noise
phi += angle_noise
zi = np.array([dn, angle, phi, i])
z = np.vstack((z, zi))
# add noise to input
ud1 = u[0, 0] + np.random.randn() * R_sim[0, 0]
ud2 = u[1, 0] + np.random.randn() * R_sim[1, 1]
ud = np.array([[ud1, ud2]]).T
xd = motion_model(xd, ud)
return xTrue, z, xd, udmain에서 초기화한 랜드마크 중 관측 범위 내에있는 랜드마크를 관측합니다. 이때 Q_sim, R_sim 각각 관측 노이즈와 컨트롤 노이즈가 추가됩니다.
def graph_based_slam(x_init, hz):
    print("start graph based slam")

    z_list = copy.deepcopy(hz)
    x_opt = copy.deepcopy(x_init)
    nt = x_opt.shape[1]
    n = nt * STATE_SIZE

    for itr in range(MAX_ITR):
        edges = calc_edges(x_opt, z_list)

        H = np.zeros((n, n))
        b = np.zeros((n, 1))

        for edge in edges:
            H, b = fill_H_and_b(H, b, edge)

        # to fix origin
        H[0:STATE_SIZE, 0:STATE_SIZE] += np.identity(STATE_SIZE)

        dx = - np.linalg.inv(H) @ b

        for i in range(nt):
            x_opt[0:3, i] += dx[i * 3:i * 3 + 3, 0]

        diff = dx.T @ dx
        print("iteration: %d, diff: %f" % (itr + 1, diff))
        if diff < 1.0e-5:
            break

    return x_opt
관측값을 이용해 실제로 graph-based slam을 수행하는 코드입니다. 코드를 보기 전에 잠깐 복기해보자면 graph-based SLAM에서는 Pose Graph를 이용합니다. Pose Graph에서 edge는 1)연속한 pose들간의 constraint, 또는 2) 한번 방문한 곳 근처를 다시 방문했을 때 대응되는 두 pose간의 constraint로 이루어집니다. 2)의 경우 Pose Graph에 기록된 로봇의 pose와 관측값으로 역산한 pose의 차이를 통해 최적화를 진행하는데 실제로 그렇게 구현되어있는지 보도록 하겠습니다. Pose, Observation의 history를 받아 edge를 생성합니다.
def calc_edges(x_list, z_list):
    edges = []
    cost = 0.0
    z_ids = list(itertools.combinations(range(len(z_list)), 2))

    for (t1, t2) in z_ids:

        x1, y1, yaw1 = x_list[0, t1], x_list[1, t1], x_list[2, t1]
        x2, y2, yaw2 = x_list[0, t2], x_list[1, t2], x_list[2, t2]

        if z_list[t1] is None or z_list[t2] is None:
            continue  # No observation

        for iz1 in range(len(z_list[t1][:, 0])):
            for iz2 in range(len(z_list[t2][:, 0])):
                if z_list[t1][iz1, 3] == z_list[t2][iz2, 3]:
                    d1 = z_list[t1][iz1, 0]
                    angle1, phi1 = z_list[t1][iz1, 1], z_list[t1][iz1, 2]
                    d2 = z_list[t2][iz2, 0]
                    angle2, phi2 = z_list[t2][iz2, 1], z_list[t2][iz2, 2]

                    edge = calc_edge(x1, y1, yaw1, x2, y2, yaw2, d1,
                                     angle1, d2, angle2, t1, t2)

                    edges.append(edge)
                    cost += (edge.e.T @ edge.omega @ edge.e)[0, 0]

    print("cost:", cost, ",n_edge:", len(edges))
    return edges
지금까지 거쳐온 pose들을 탐색하며 같은 랜드마크를 관측한 경우 edge를 만들어낸다는 사실을 알 수 있습니다. 2) case를 loop closure의 경우만 생각했는데 인접한 위치에선 관측이 비슷하니 매번 최적화가 가능한 것 같습니다. edge를 생성한 후 cost 값을 누적해줍니다.
다시 graph_based_slam으로 돌아가서 오차가 충분히 줄어들때까지 루프를 돌며 pose값을 갱신합니다. Pose가 갱신되고 로봇이 움직이다가 다시 slam을 수행한다고 생각하면 pose가 더 많이 쌓였기 때문에 H 행렬의 크기는 커질 것입니다. 하지만 움직이면서 각 pose에서 관측할 수 있는 랜드마크가 달라질 것이기 때문에 행렬은 갈수록 희소해질 것이란 것을 예측할 수 있습니다.
'SLAM' 카테고리의 다른 글
| PTAM: Parallel Tracking and Mapping for Small AR Workspaces (0) | 2022.01.23 |
|---|---|
| Mono-Visual Odometry Example with Kitti-Dataset (0) | 2021.11.04 |
| Graph-based SLAM using Pose-Graph (0) | 2021.10.10 |
| EKF SLAM with Example Code (0) | 2021.09.23 |
| EKF SLAM (0) | 2021.09.21 |


댓글